It’s been quite a while since my last post here. It doesn’t mean I’ve forgotten about this place, just that I’ve had quite an intense summer (“work hard, play hard”). Now I’m excited to see the first results of my work: this week I’ll be at SYNASC 2012, in Timisoara, presenting my paper on summarizing microblogging streams. Here are the slides:
Tag Archives: twitter
The story of the Oscar predictions
Yesterday was uberVU’s third hackaton. Talking with one of the organizers, I found out that the guys there were planning to create an infographic about predicting the Oscar winners. UberVU.com was already tracking the volume of tweets and the sentiment for the nominees, so all the data was available.
Hmm, but can we make the infographic better? I thought about the movie posters and how they include captions from reviews, like “A shock-a-minute masterpiece” from here. Could I get such stuff out of tweets and include it in the infographic?
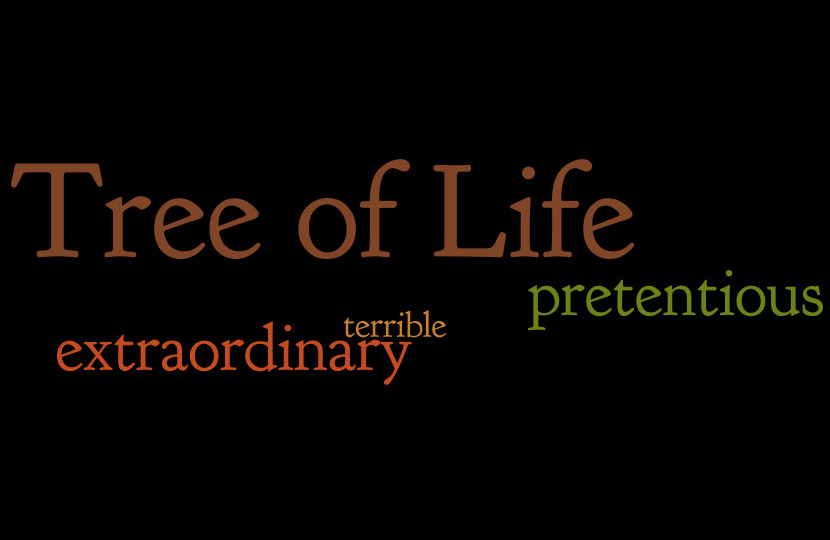
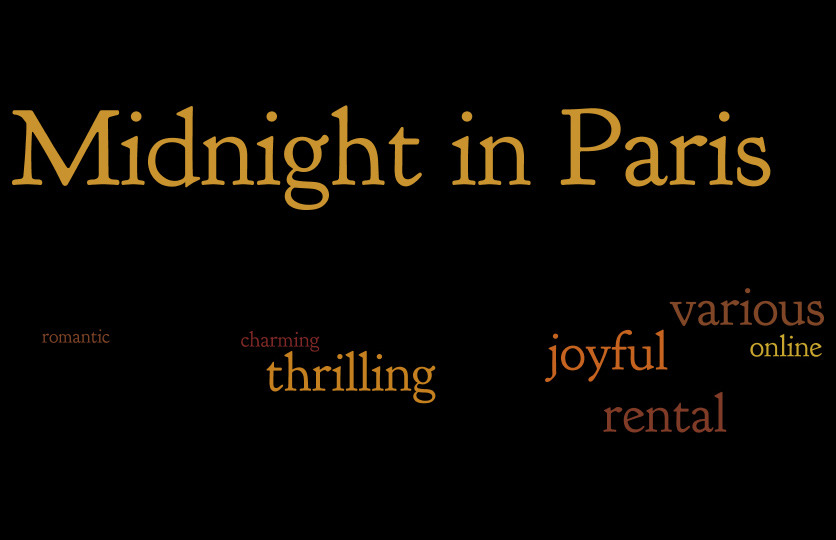
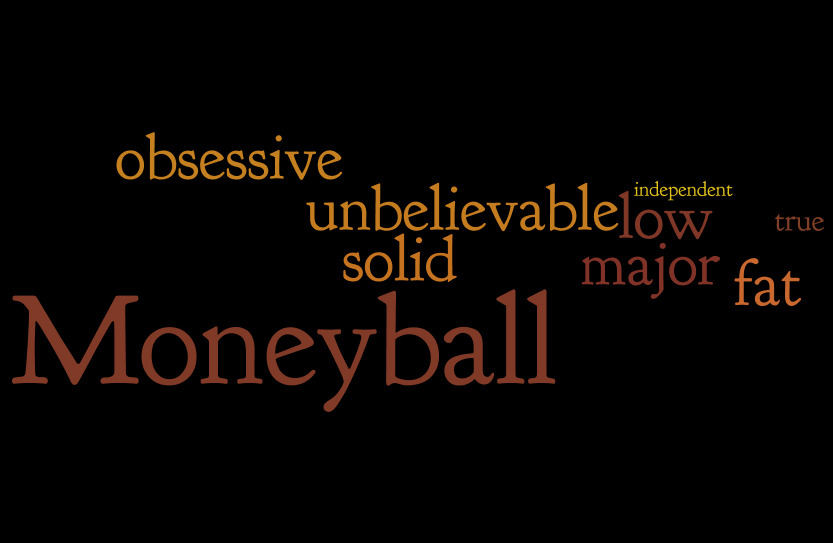
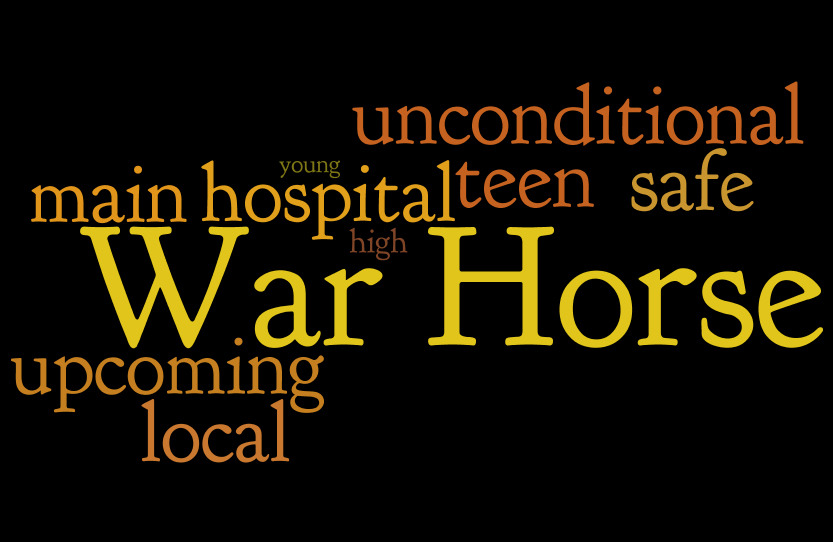
Well, let’s try. I started writing some code to get frequent captions out of tweets, but there were too many noisy expressions that would require some advanced filtering. I decided to stick just to words and finally just to adjectives. The approach is inspired by a post on Edwin Chen’s blog.
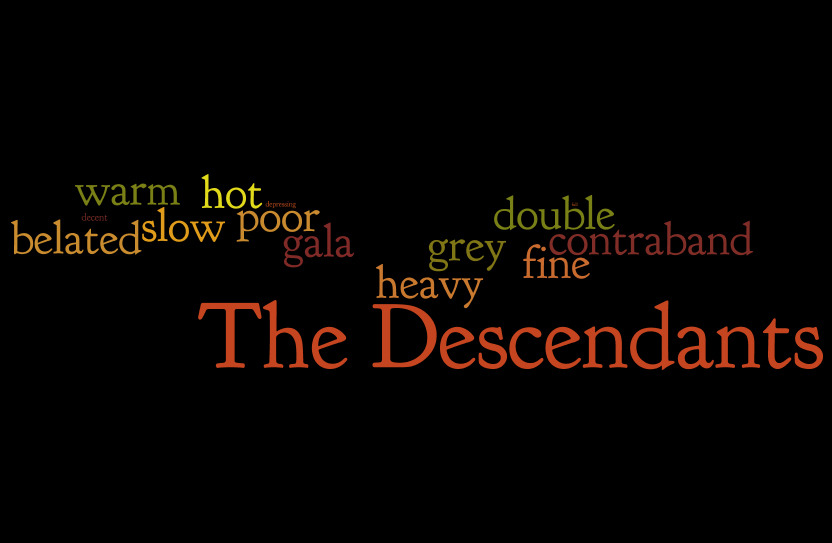
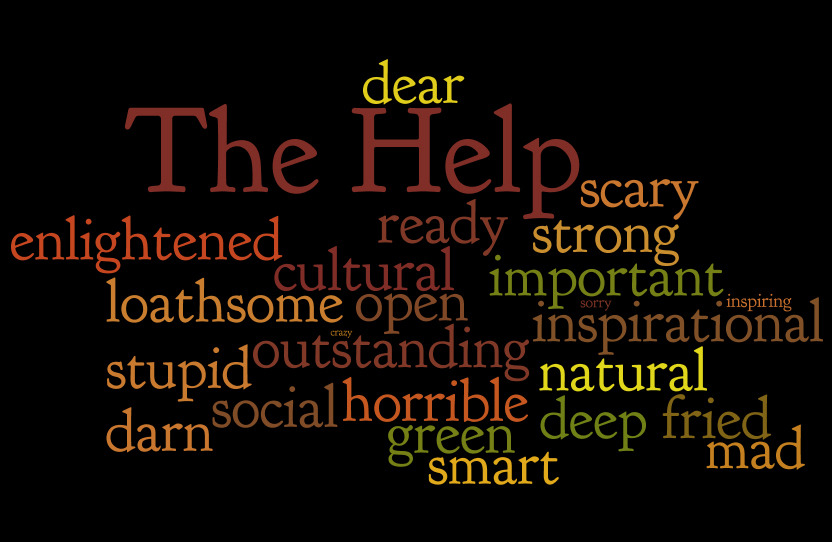
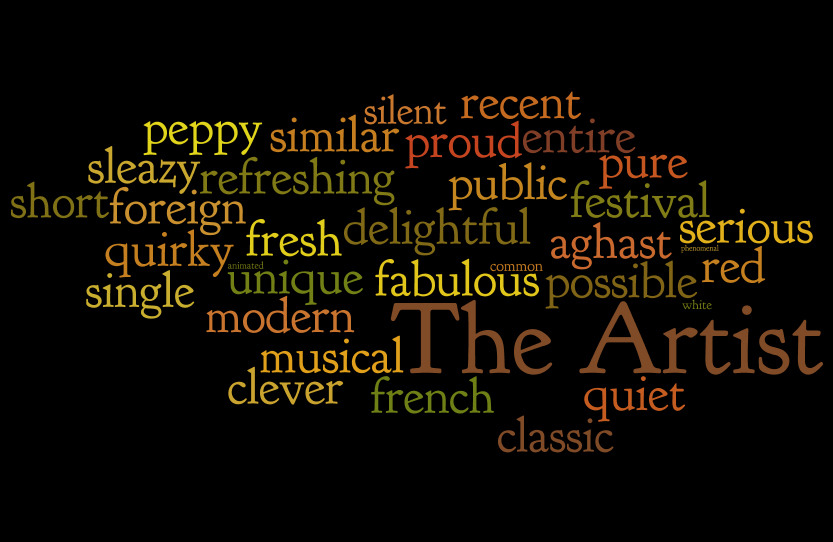
Unfortunately, the guys I hoped would help me with the infographic didn’t come. I’m not very good in Photoshop (I know how to crop and stuff, but an infographic requires a little more skill). So I decided to just build a tagcloud using wordle.net.
I sorted the movies by the number of adjectives they attracted. If the movies are ranked based on how many emotions they determine in their viewers, then this would be the final ranking (from last to first):


The code is available on github.
Update: The guys from uberVU have created the infographic, inserting some of the stuff above, and they have posted it on Techcrunch. They used sentiment data to predict the winner (choosing “The Help”). In the end, the winner chosen by the jury proved to be “The Artist”.
El Clasico on Twitter
Saturday evening – at the theatre. It was the worst play I’ve ever seen. The room was half empty (which is .. rare, to say the least). A few people around me were dozing off. Meanwhile, I was counting sleeping people or analysing the beautiful decorations. I quit trying to figure out what all the metaphors in the play meant, all I wanted were some subtitles, to translate what the actors said into concrete facts and events.
Anyway, I then remembered that El Clasico (the match between Real Madrid and Barcelona) was just a couple of hours away. I started wondering what’s the impact of this sporting event on Twitter.
As soon as I got back home, I hacked some code to monitor a few Twitter keywords (“barcelona”, “real madrid”, “el clasico”, …) and then left it running.
Next day, I checked out the “harvest”. It collected over 3000 tweets over an interval of 3h30′, ranging from 3 to almost 100 tweets per minute. I plotted the histogram and highlighted the first and second half (with grey shading) and the 4 goals (with red lines).
The histogram highlights spikes in tweets at the beginning of the match, as well as in the end of each half. A little more interesting is the behaviour after a goal – a short drop (everybody stops to see the goal) followed by a spike (after checking the replays, people tweet about it).
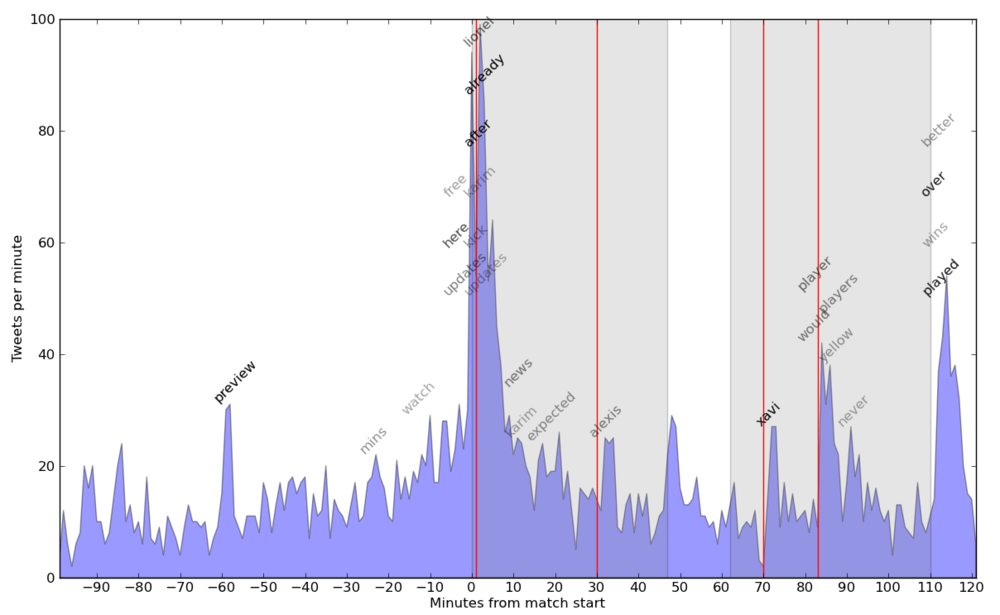
Now let’s put some keywords on the chart. Get the most frequent words (I filtered for overall count > 25). Now compute each word’s count over 5 minute windows, plus the mean and standard deviation for these counts. Going over the counts again, I plot words with a window frequency a lot higher when compared to the mean (I used (freq – mean) / st_deviation > 3.5). I set the text opacity depending on the above score. Code is available here.
The words this algorithm found are pretty good. It found 2 of the goal scorers, another player with the decisive pass, some typical end-of-the-match words, as well as the occasional spam (one hour or a few minutes before the start). Possible improvement: Normalise frequencies for each window – will check it out in a future project.