Yesterday was uberVU’s third hackaton. Talking with one of the organizers, I found out that the guys there were planning to create an infographic about predicting the Oscar winners. UberVU.com was already tracking the volume of tweets and the sentiment for the nominees, so all the data was available.
Hmm, but can we make the infographic better? I thought about the movie posters and how they include captions from reviews, like “A shock-a-minute masterpiece” from here. Could I get such stuff out of tweets and include it in the infographic?
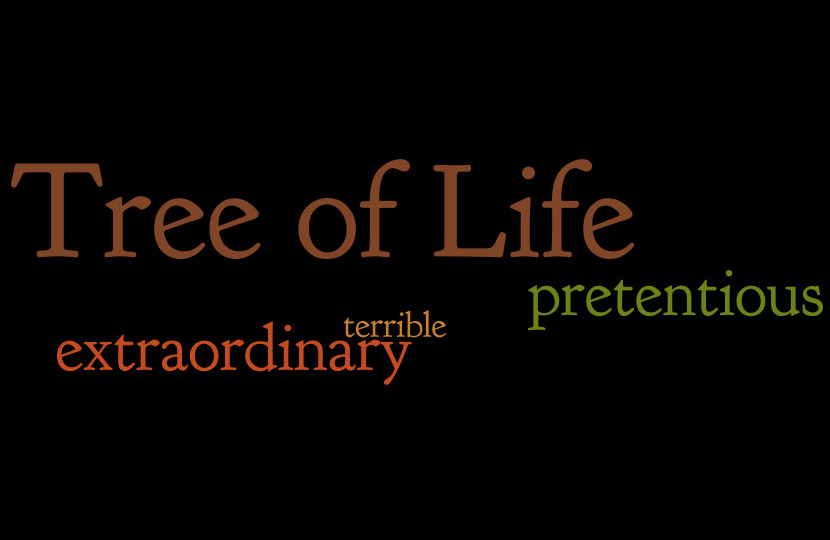
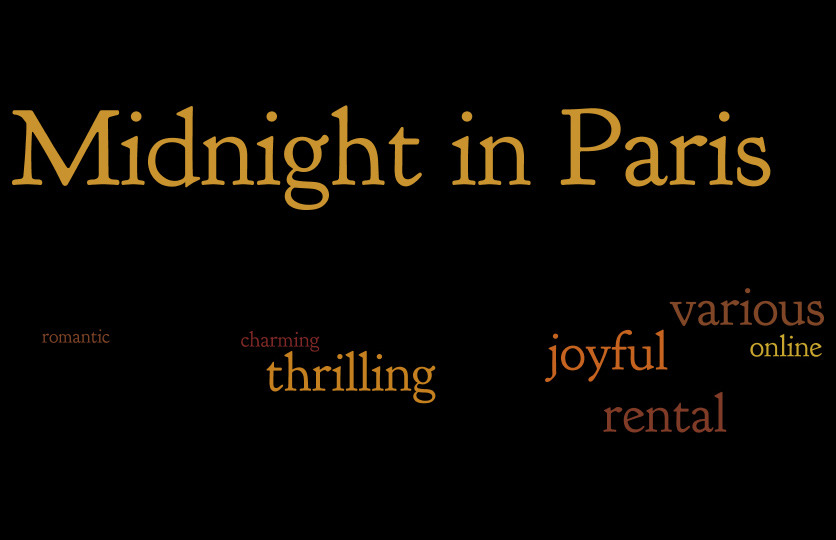
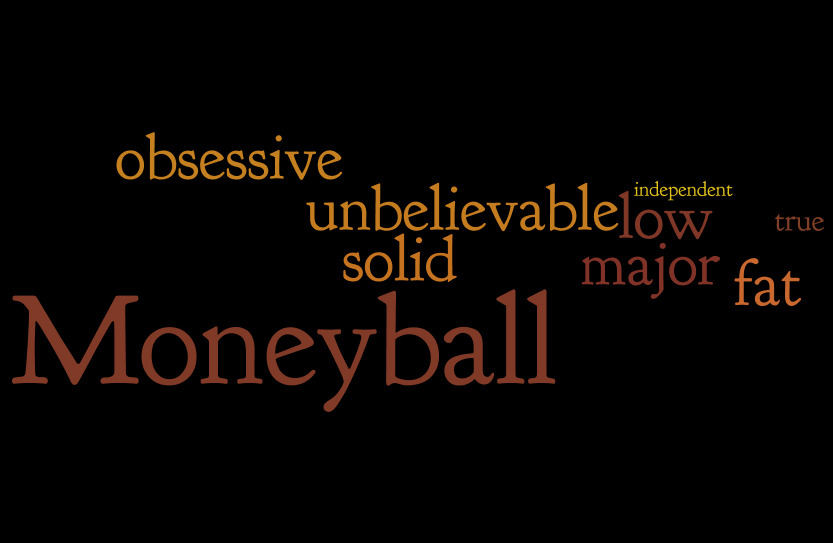
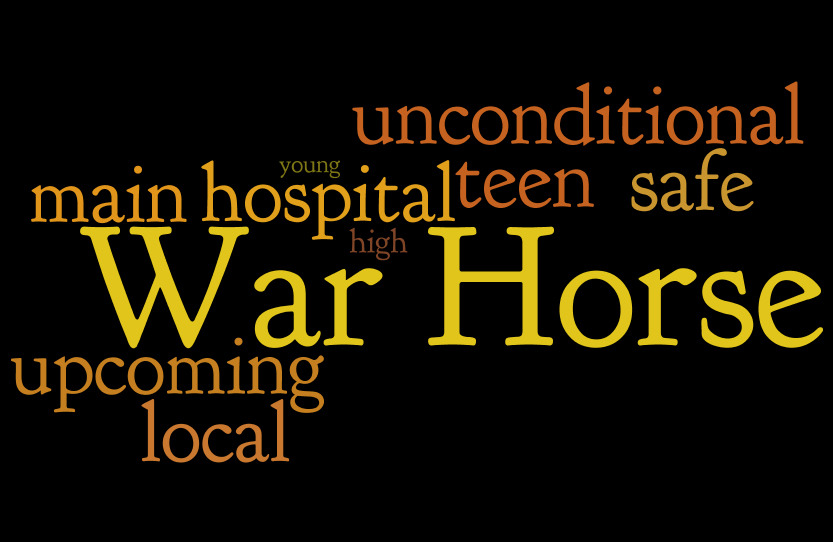
Well, let’s try. I started writing some code to get frequent captions out of tweets, but there were too many noisy expressions that would require some advanced filtering. I decided to stick just to words and finally just to adjectives. The approach is inspired by a post on Edwin Chen’s blog.
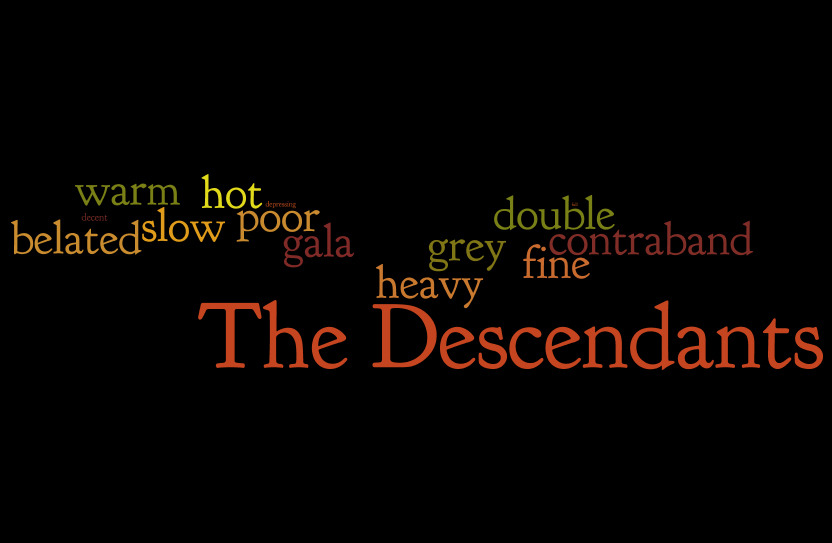
Unfortunately, the guys I hoped would help me with the infographic didn’t come. I’m not very good in Photoshop (I know how to crop and stuff, but an infographic requires a little more skill). So I decided to just build a tagcloud using wordle.net.
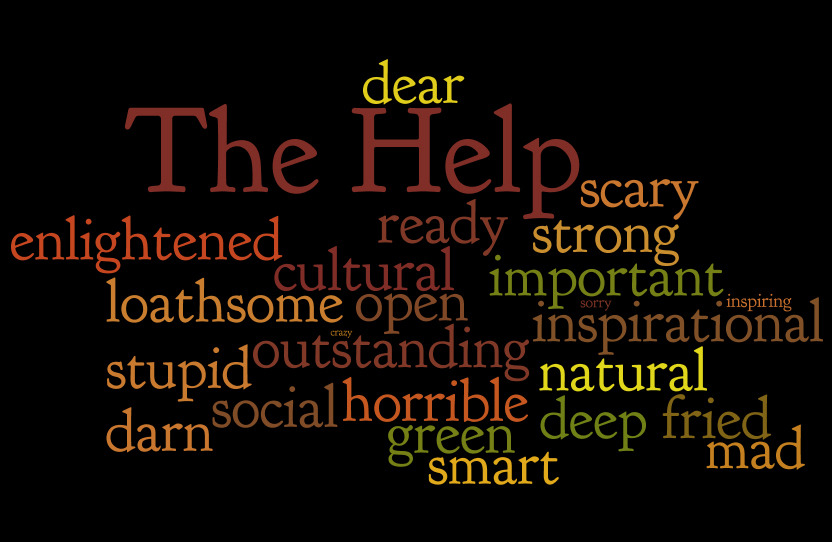
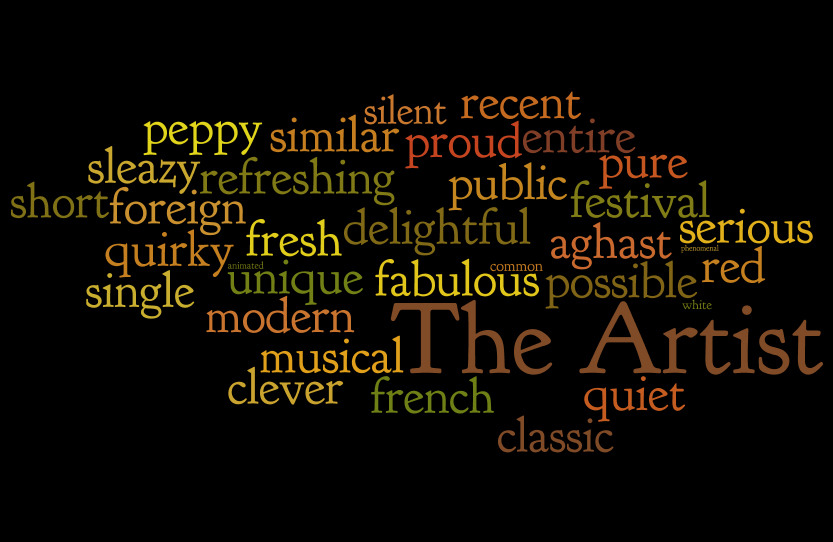
I sorted the movies by the number of adjectives they attracted. If the movies are ranked based on how many emotions they determine in their viewers, then this would be the final ranking (from last to first):


The code is available on github.
Update: The guys from uberVU have created the infographic, inserting some of the stuff above, and they have posted it on Techcrunch. They used sentiment data to predict the winner (choosing “The Help”). In the end, the winner chosen by the jury proved to be “The Artist”.